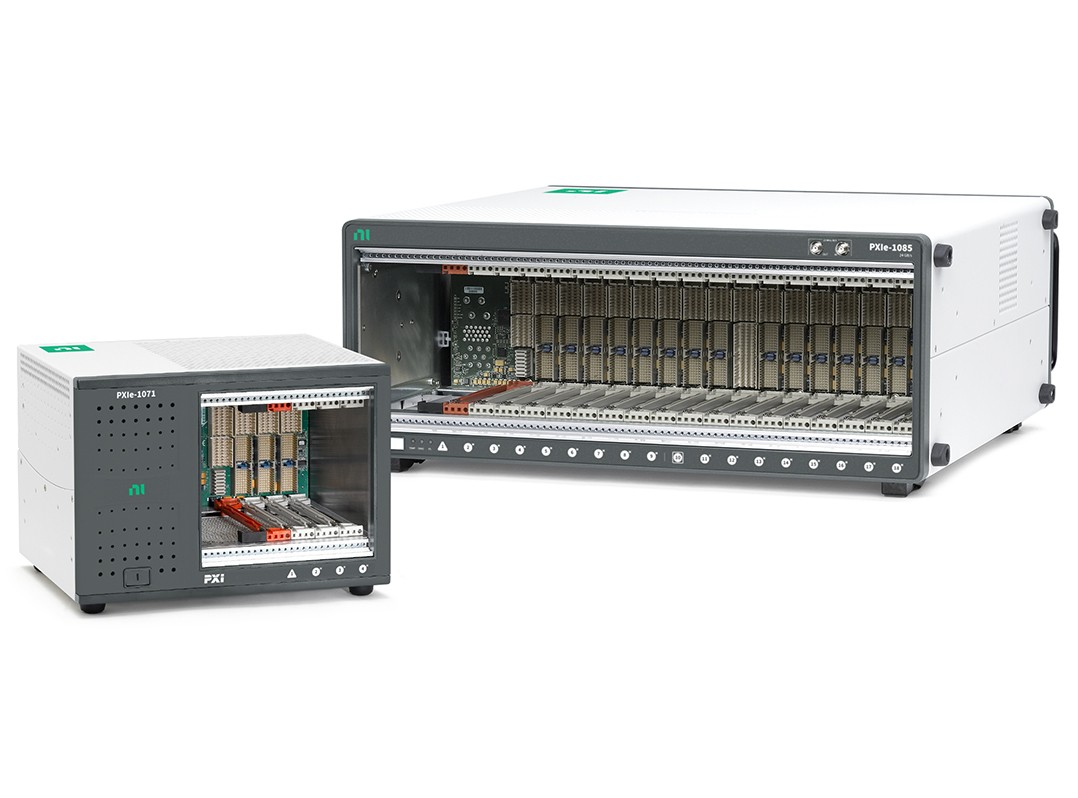
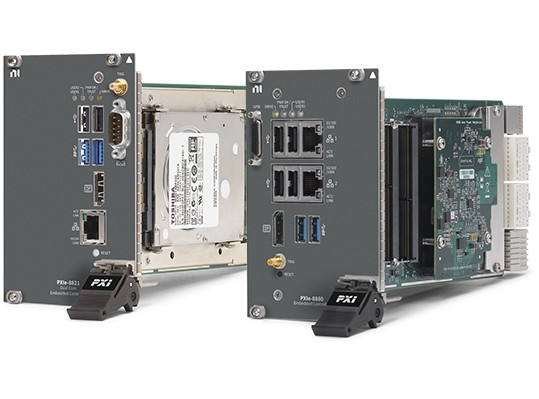
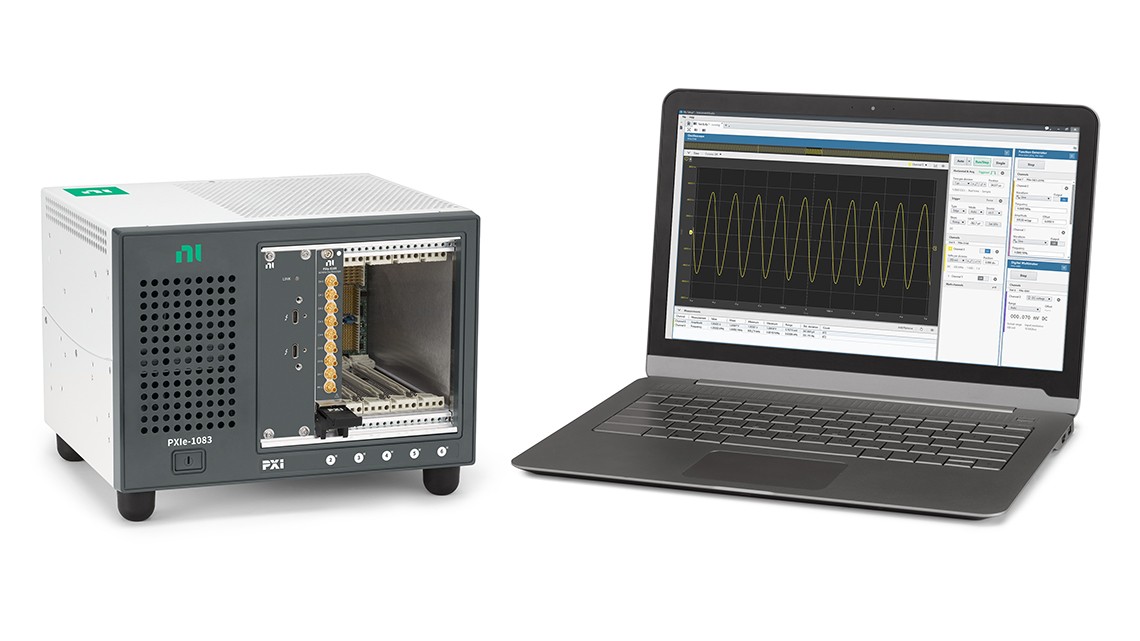
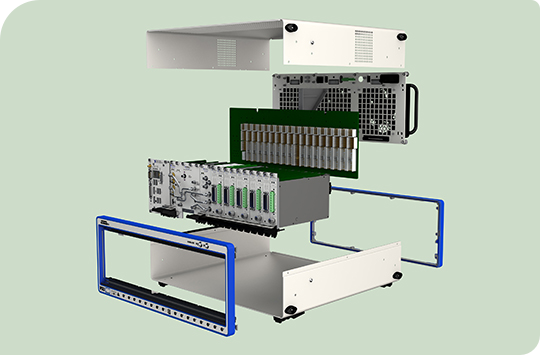
"National Instruments hardware provided the modularity to measure many different phenomena using a single platform and to synchronize these measurements across multiple systems."
The Challenge: Accurately testing how a vehicle’s suspension system interacts with a complex structure like a curved bridge during an earthquake.
The Solution: Building large bridge sections, testing them with large hydraulic shakers that simulate earthquakes, and using NI LabVIEW software and PXI hardware to take measurements such as strain, force, and displacement to characterize the behavior of the supporting structures as well as the movement of the bridge and vehicles.
Many years ago, to test a bridge under earthquake loading, engineers would wire-rope a bulldozer to the side of a bridge and pull it over before cutting the cable to let the bridge free vibrate. Although this method helped determine some of the dynamic properties of the structure, it was quite difficult to find a potential bridge candidate. As a result, we decided to bring a bridge into the laboratory. In 1990, we built our first large-scale laboratory and outfitted it with two 50-ton payload capacity shake tables.
We started with simple bridge columns but our needs quickly escalated, which meant that a few instruments and a closed-software data acquisition system were not going to cut it. At that point, we chose NI hardware and NI LabVIEW software because they enabled rapid prototyping of ideas and an unlimited scope of instrumentation and conditioning. Today, we have four shake tables, many NI systems, and a second laboratory under construction. Hundreds of bridge columns, dozens of bridges, thousands of tests, and numerous gigabytes of data later, we tested the largest curved bridge with six fully loaded trucks on top.
Figure 1. Attaching Instruments and Cables
Research Goals
The University of Nevada, Reno is one of the leading research facilities for earthquake engineering and is a member of the Network of Earthquake Engineering Simulation (NEES). Earthquake and structural engineering involves the analysis and design of structures that support or resist loads. These loads may be “service” loads, such as traffic loads on a bridge or furniture loads in a building, or they may be “extreme” loads such as winds, floods, and earthquakes.
Engineers typically design bridges using individual loading conditions such as live vehicle loads or earthquake loads. However, bridges are not being designed for both of these conditions at once. Although you can model complete bridge systems in a computer, how accurate are your modeling assumptions without the physical tests to back them up? What happens if an earthquake occurs during rush hour, when the bridge is loaded with bumper-to-bumper traffic?
The series of tests we performed will allow UNR researchers and graduate students to calibrate their computer models and simulations. It will also allow practicing engineers to understand the effects of vehicles on bridge response during an earthquake and may ultimately lead to changes in the design codes.
Figure 2: Conceptual Model
Implementation
We wanted to be able to create an earthquake at any time to measure its effects on both a bridge and the vehicles on top of the bridge. To achieve this goal, we built a model of a curved bridge, spanning the entire length of the laboratory, on top of four MTS Systems shake tables. To fit everything in the laboratory, we used a 40 percent-scale model to represent a three-section bridge measuring 145 ft long and 16 ft high, with an 80 ft radius. To simulate live loads, we placed a series of six commercial trucks filled with sand on top of the bridge. Our researchers wanted to see if these loads dampened or amplified the response of the bridge.
Figure 3: One of Three Bridge Decks "In Flight"
Our data acquisition system needed to measure hundreds of conditioned channels in real time to ensure that all the data was captured reliably. The shake tables, the data acquisition system, the controllers, and the data analysis machines must work together flawlessly every time. And all the systems must communicate and operate in lock-step with each other.
The NI LabVIEW Real-Time Module made creating a deterministic system a quick process since it can be easily programmed. A key element of LabVIEW Real Time is its unique ability to operate on multiple cores. Every core is utilized on every machine distributing the processing load to optimize the task as much as possible. To easily facilitate the inter-machine communication, we chose Curtiss-Wright/Systran SCRAMNet reflective memory. Reflective memory is simply shared memory between physically separate computers. Data written to one memory location is transmitted almost instantaneously to all of the other nodes through fiber optic cabling. This transmission is handled in the ScramNET hardware, and LabVIEW allows reading, writing, and IRQ monitoring, thus providing the required communication and clocking.
Figure 4: Example of Reflective Memory Operation
Architecture
We used NI hardware, LabVIEW software, and the LabVIEW Real-Time Module to seamlessly connect the following systems, which are distributed over a large area:
Four physically independent DAQ systems each containing
One quad-core controller running LabVIEW Real-Time
One NI CompactRIO system monitoring the shake-table hydrostatic bearings
One single-core controller running LabVIEW Real-Time acquiring SMPTE and GPS timestamps
One quad-core controller running LabVIEW Real-Time with an RM node creating timing signals for an external vision system
One dual-core controller running LabVIEW providing instrument calibration checks
Three Windows PCs running LabVIEW for analyzing post-test data
Custom data analysis software created in LabVIEW for researchers and students
Benefits
NI hardware, along with the IEEE 1451.4 plug-and-play standard, greatly reduced setup time to minutes instead of days, and eliminated human error related to instrument calibration information. The LabVIEW Real-Time Module ensured all the systems ran synchronously and deterministically, a major requirement for the servo-hydraulic shake tables and data acquisition systems. The command generators programmed in LabVIEW Real-Time ran on schedule, successfully keeping the shake tables in sync. LabVIEW helped us analyze data instantaneously during testing. Also, we used LabVIEW to instantly replicate critical data to be backed up on multiple FTP machines throughout the campus and NEES repository.
Figure 5: Example LabVIEW Analysis Software Built for Researchers and Students
Outcome
Our research project was 100% successful. There’s no question we wouldn’t be doing these kinds of tests without National Instruments. All data was collected accurately, then processed and stored as required. The shake table system accurately produced the earthquake records required by the investigators, and the NI CompactRIO system successfully monitored the hydraulic system, ensuring any potential problems would be immediately recognized. Due to the size and cost of this one experiment, everything has to work perfectly every time you push the "start" button, and National Instruments and LabVIEW did exactly that.
Author Information:
Dr. Patrick Laplace, Ph.D. University of Nevada, Reno
Department of Civil and Environmental Engineering/0258 Reno, NV 89557 United States Tel: (775) 784-8080 laplace@unr.edu